- Specify Tensorflow version in Google Colab `%tensorflow_version 2.x`. It is not recommended to use pip install in Google Colab: quote "We recommend against using pip install to specify a particular TensorFlow version for GPU backends. Colab builds TensorFlow from source to ensure compatibility with our fleet of GPUs. Versions of TensorFlow fetched from PyPI by pip may suffer from performance problems or may not work at all."
- Check tensorflow version after installing `import tensorflow` `print(tensorflow.__version__)`
- TPU for Tensorflow 2.0 is not yet available. "TPUs are not fully supported in Tensorflow 2.0. We expect they will be supported in Tensorflow 2.1. Follow along on GitHub."
- tf.layers from Tensorflow 1.0 is going away in Tensorflow 2.0
- Previously use keras pip install keras
- Currently in Tensorflow 2.0 use keras : from tensorflow import keras
Learning machine learning? Specifically trying out neural networks for deep learning? You likely have run into the Softmax function, a wonderfulactivation function that turns numbers aka logits into probabilities thatsum to one. Softmax function outputs a vector that represents the probability distributions of a list of potential outcomes. It’s also a core element used in deep learning classification tasks (more on this soon). We will help you understand the Softmax function in a beginner friendly manner by showing you exactly how it works — by coding your very own Softmax function in python.
Reposted with permission.
If you are implementing Softmax in Pytorch and you already know Pytorch well, scroll down to the Deep Dive section and grab the code.
This article has gotten really popular — 1800 claps and counting and it is updated constantly. Latest update April 4, 2019: updated word choice, listed out assumptions and added advanced usage of Softmax function in Bahtanau Attention for neural machine translation. See full list of updates below. You are welcome to translate it. We would appreciate it if the English version is not reposted elsewhere. If you want a free read, just use incognito mode in your browser. A link back is always appreciated. Comment below and share your links so that we can link to you in this article. Claps on Medium help us earn $$$. Thank you in advance for your support!


Skill pe-requisites: the demonstrative codes are written with Python list comprehension (scroll down to see an entire section explaining list comprehension). The math operations demonstrated are intuitive and code agnostic: it comes down to taking exponentials, sums and division aka the normalization step. This article is for your personal use only, not for production or commercial usage. Please read our disclaimer.

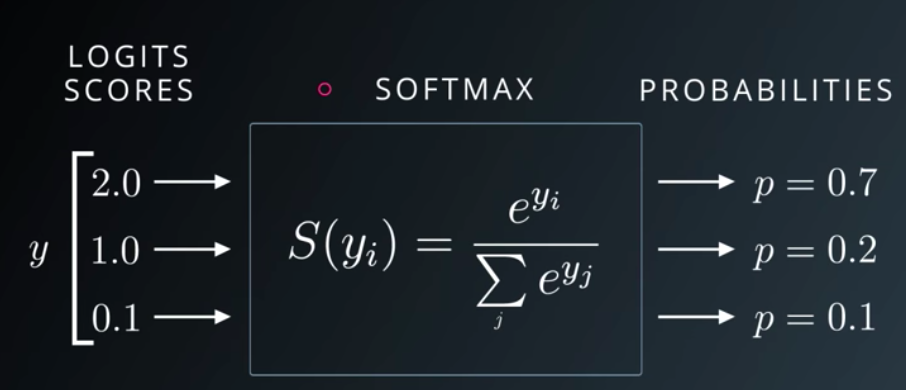
The above Udacity lecture slide shows that Softmax function turns logits [2.0, 1.0, 0.1] into probabilities [0.7, 0.2, 0.1], and the probabilities sum to 1.
In deep learning, the term logits layer is popularly used for the last neuron layer of neural network for classification task which produces raw prediction values as real numbers ranging from [-infinity, +infinity ]. — WikipediaLogits are the raw scores output by the last layer of a neural network. Before activation takes place.
Softmax is not a black box. It has two components: special number
e to some power divide by a sum of some sort.y_i refers to each element in the logits vector y. Python and Numpy code will be used in this article to demonstrate math operations. Let’s see it in code:logits = [2.0, 1.0, 0.1]
import numpy as npexps = [np.exp(i) for i in logits]
We use
numpy.exp(power) to take the special number eto any power we want. We use python list comprehension to iterate through each i of the logits, and compute np.exp(i). If you are not familiar with Python list comprehension, read the explanation in the next section first. Logit is another name for a numeric score. The result is stored in a list called exps. The variable name is short for exponentials.
Replacing
i with logit is another verbose way to write outexps = [np.exp(logit) for logit in logits] . Note the use of plural and singular nouns. It’s intentional.
We just computed the top part of the Softmax function. For each logit, we took it to an exponential power of
e. Each transformed logit j needs to be normalized by another number in order for all the final outputs, which are probabilities, to sum to one. Again, this normalization gives us nice probabilities that sum to one!
We compute the sum of all the transformed logits and store the sum in a single variable
sum_of_exps, which we will use to normalize each of the transformed logits.sum_of_exps = sum(exps)
Now we are ready to write the final part of our Softmax function: each transformed logit
jneeds to be normalized by sum_of_exps , which is the sum of all the logits including itself.softmax = [j/sum_of_exps for j in exps]
Again, we use python list comprehension: we grab each transformed logit using
[j for j in exps]divide each j by the sum_of_exps.
List comprehension gives us a list back. When we print the list we get
>>> softmax
[0.6590011388859679, 0.2424329707047139, 0.09856589040931818]
>>> sum(softmax)
1.0
The output rounds to [0.7, 0.2, 0.1] as seen on the slide at the beginning of this article. They sum nicely to one!
Extra — Understanding List Comprehension
This post uses a lot of Python list comprehension which is more concise than Python loops. If you need help understanding Python list comprehension type the following code into your interactive python console (on Mac launch terminal and type
python after the dollar sign $ to launch).sample_list = [1,2,3,4,5] # console returns Nonesample_list # console returns [1,2,3,4,5]#print the sample list using list comprehension [i for i in sample_list] # console returns [1,2,3,4,5] # note anything before the keyword 'for' will be evaluated # in this case we just display 'i' each item in the list as is # for i in sample_list is a short hand for # Python for loop used in list comprehension [i+1 for i in sample_list] # returns [2,3,4,5,6] # can you guess what the above code does? # yes, 1) it will iterate through each element of the sample_list # that is the second half of the list comprehension # we are reading the second half first # what do we do with each item in the list? # 2) we add one to it and then display the value # 1 becomes 2, 2 becomes 3# note the entire expression 1st half & 2nd half are wrapped in [] # so the final return type of this expression is also a list # hence the name list comprehension # my tip to understand list comprehension is # read the 2nd half of the expression first # understand what kind of list we are iterating through # what is the individual item aka 'each' # then read the 1st half # what do we do with each item# can you guess the list comprehension for # squaring each item in the list? [i*i for i in sample_list] #returns [1, 4, 9, 16, 25]
Intuition and Behaviors of Softmax Function
If we hard code our label data to the vectors below, in a format typically used to turn categorical data into numbers, the data will look like this format below.
[[1,0,0], #cat
 [0,1,0], #dog
 [0,0,1],] #bird
Optional Reading: FYI, this is an identity matrix in linear algebra. Note that only the diagonal positions have the value 1 the rest are all zero. This format is useful when the data is not numerical, the data is categorical, each category is independent from others. For example,
1 star yelp review, 2 stars, 3 stars, 4 stars, 5 starscan be one hot coded but note the five are related. They may be better encoded as 1 2 3 4 5 . We can infer that 4 stars is twice as good as 2 stars. Can we say the same about name of dogs?Ginger, Mochi, Sushi, Bacon, Max , is Macon 2x better than Mochi? There’s no such relationship. In this particular encoding, the first column represent cat, second column dog, the third column bird.
The output probabilities are saying 70% sure it is a cat, 20% a dog, 10% a bird. One can see that the initial differences are adjusted to percentages. logits = [2.0, 1.0, 0.1]. It’s not 2:1:0.1. Previously, we cannot say that it’s 2x more likely to be a cat, because the results were not normalized to sum to one.
The output probability vector is
[0.7, 0.2, 0.1] . Can we compare this with the ground truth of cat [1,0,0] as in one hot encoding? Yes! That’s what is commonly used in cross entropy loss (We have a cool trick to understand cross entropy loss and will write a tutorial about it. Read it here.). In fact cross entropy loss is the “best friend” of Softmax. It is the most commonly used cost function, aka loss function, aka criterion that is used with Softmax in classification problems. More on that in a different article.
Why do we still need fancy machine learning libraries with fancy Softmax function? The nature of machine learning training requires ten of thousands of samples of training data. Something as concise as the Softmax function needs to be optimized to process each element. Some say that Tensorflow broadcasting is not necessarily faster than numpy’s matrix broadcasting though.
Watch this Softmax tutorial on Youtube
Visual learner? Prefer watching a YouTube video instead? See our tutorial below.
Deeper Dive into Softmax
Softmax is an activation function. Other activation functions include RELU and Sigmoid. It is frequently used in classifications. Softmax output is large if the score (input called logit) is large. Its output is small if the score is small. The proportion is not uniform. Softmax is exponential and enlarges differences - push one result closer to 1 while another closer to 0. It turns scores aka logits into probabilities. Cross entropy (cost function) is often computed for output of softmax and true labels (encoded in one hot encoding). Here’s an example of Tensorflow cross entropy computing function. It computes softmax cross entropy between logits and labels. Softmax outputs sum to 1 makes great probability analysis. Remember the takeaway is: the essential goal of softmax is to turn numbers into probabilities.
Thanks. I can now deploy this to production. Uh no. Hold on! Our implementation is meant to help everyone understand what the Softmax function does. It uses for loops and list comprehensions, which are not efficient operations for production environment. That’s why top machine learning frameworks are implemented in C++, such as Tensorflow and Pytorch. These frameworks can offer much faster and efficient computations especially when dimensions of data get large, and can leverage parallel processing. So no, you cannot use this code in production. However, technically if you train on a few thousand examples (generally MLneeds more than 10K records), your machine can still handle it, and inference is possible even on mobile devices! Thanks Apple Core ML. Can I use this softmax on imagenet data? Uh definitely no, there are millions of images. Use Sklearn if you want to prototype. Tensorflow for production. Pytorch 1.0 added support for production as well. For research Pytorch and Sklearn softmax implementations are great.
Best Loss Function / Cost Function / Criterion to Use with Softmax
You have decided to choose Softmax as the final function for classifying your data. What loss function and cost function should you use with Softmax? The theoretical answer is Cross Entropy Loss (let us know if youwant an article on that. We have a full pipeline of topics waiting for your vote).
Tell me more about Cross Entropy Loss. Sure thing! Cross Entropy Loss in this case measures how similar your predictions are to the actual labels. For example if the probabilities are supposed to be
[0.7, 0.2, 0.1] but you predicted during the first try [0.3, 0.3, 0.4], during the second try [0.6, 0.2, 0.2] . You can expect the cross entropy loss of the first try , which is totally inaccurate, almost like a random guess to have higher loss than the second scenario where you aren’t too far off from the expected.Read our full Cross Entropy Loss tutorial here.Deep Dive Softmax
For Softmax deep dive read our article Softmax Beyond the Basics. There you can also find explanation that Softmax and Sigmoid are equivalent for binary classification. Different flavors and implementations of Softmax in Tensorflow and Pytorch. Coming soon in Softmax Beyond the Basics: How to graph Softmax function? Is there a more efficient way to calculate Softmax for big datasets? Stay tuned. Get alerts subscribe@uniqtech.co
Softmax Formula in Pytorch
def softmax(x):
    return torch.exp(x)/torch.sum(torch.exp(x), dim=1).view(-1,1)
dim=1 is for torch.sum() to sum each row across all the columns, .view(-1,1) is for preventing broadcasting. For details of this formula, visit our Softmax Beyond the Basics article. The above is the formula. If you are just looking for an API then use softmax or LogSoftmax see Pytorch documentation.
Bahtanau Attention for Neural Machine Translation — Softmax Function in Real Time
In the neural machine translation architecture, outlined by Dimitry Bahtanau in Neural machine translation by jointly learn to align and translate (2014), uses Softmax output as weights to weigh each of the hidden states right before producing the final output.
Softmax Function BehaviorBecause Softmax function outputs numbers that represent probabilities, each number’s value is between 0 and 1 valid value range of probabilities. The range is denoted as
[0,1]. The numbers are zero or positive. The entire output vector sums to 1. That is to say when all probabilities are accounted for, that’s 100%.Update History
- August 2019 Code snippet for Pytorch Softmax
- July 2019 A discussion on cross entropy evaluation of Softmax
- June 2019 Correction: there was an incorrect statement about Sigmoid and it has been removed. Remember Sigmoid predicts one class for example Prob(class=A) to calculate Prob(class=B) just do 1-Prob(class=A) because there are only two classes in binary classification. It’s an either or relation. Also changed the Deep Dive section.
- May 11 2019 In Progress: a deep dive on Softmax source code Softmax Beyond the Basics (post under construction): implementation of Softmax in Pytorch Tensorflow, Softmax in practice, in production.
- Coming soon: citation for all the sections to make the article beginner friendly and robust at the same time.
- Coming soon: a discussion on graphing Softmax function
- InProgress May 11 2019: Softmax Beyond the Basics, Softmax in textbooks and university lecture slides
- Coming soon: cross entropy loss tutorial
- Coming soon: logsoftmax function explained — — — (Need more citation and details. Section under construction) Logits are useful too
- Logits, aka the scores before Softmax activation, are useful too. Is there a reason to delay activation with Softmax? Softmax turn logits into numbers between zero and one. In deep learning, where there are many multiplication operations, a small number subsequently multiplied by more small numbers will result in tiny numbers that are hard to compute on. Hint: this sounds like the vanishing gradient problem. Sometimes logits are used in numerically stable loss calculation before using activation (Need more citation and details. Section under construction). — — -
- April 16 2019 added explanation for one hot encoding.
- April 12 2019 added additional wording explaining the outputs of Softmax function: a probability distribution of potential outcomes. In other words, a vector or a list of probabilities associated with each outcome. The higher the probability the more likely the outcome. The highest probability wins — used to classify the final result.
- April 4 2019 updated word choices, advanced use of Softmax Bahtanau attention, assumptions, clarifications, 1800 claps. Logits are useful too.
- Jan 2019 best loss function cost function criterion function to go with Softmax
